It’s summertime, which means many of us are gearing up to participate in that great American tradition: Road Trips.
Before I joined the financial services industry, road trips always reminded me of good songs, open highways, and the joy of gas station delicacies. (Personally, I’m a sucker for Honey BBQ Chex Mix.)
But now, road trips remind me of… Indexing.
Yes, Indexing.
Okay, it’s not indexing itself. But rather about one of my favorite ways to explain indexing to clients and prospects.
If you have a seminar or client meeting coming up, try this one out. It’s a powerful marketing tool for financial advisors.
Why Framing Up Indexing?
Indexing is an interest-crediting method popular in both annuity products and Indexed Universal Life (IUL) insurance products. In IUL, caps tend to be higher, and the index is an important component of how cash value grows in a policy.
For clients who are trying to balance growth and protection in their retirement approach, the concept of indexing can help. Here’s a very simple, stripped-down explanation of why:
Many IUL policies credit interest based on an index, such as the S&P 500(R). To that index, the insurance carrier applies a floor (let’s say, 0%) and a cap (let’s say, 10%). The policyholder receives interest credits based on the movement of the index each year between the floor and the cap. If the market goes up, they are credited with that rise up to the cap. If the index drops, the policyholder is protected by the 0% floor. In this way, indexing can allow savers to participate in the market’s rise and be protected from losing money if the market falls.
Indexing can create a unique pattern of returns for a saver. But it can be tricky to quickly – and powerfully – explain the benefit of indexing to your clients.
Unless… you use the analogy of a road trip.
Here’s where a little storytelling can help in marketing for financial advisors.
Driving Through the Desert
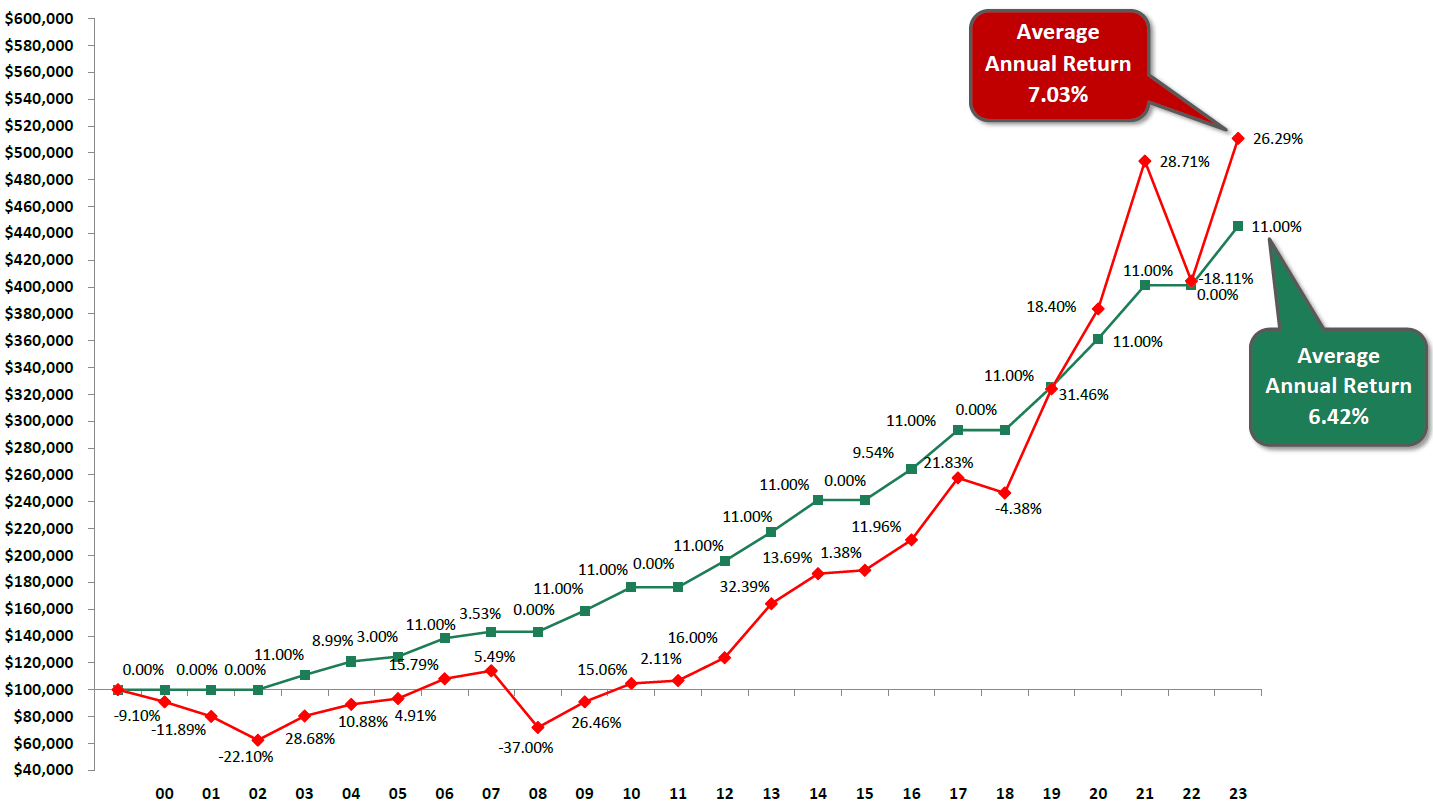
The graphic above shows how the concept of indexing works. The red line is the S&P 500® total return including dividends. The green line is an index linked to the S&P 500® with a floor of 0% and a cap of 11%.
So what does that have to do with road trips?
Here’s a story I’ve found to be incredibly powerful for helping clients understand how indexing can add unique value to their retirement approach.
A husband and wife are driving through the Arizona desert on their way to a small resort town. It’s hot, and the drive is long.
Finally, they pass a sign that reads: “Last Stop for Gas: 100 miles”.
The wife says to her husband, “We ought to stop for gas.”
But the husband looks down at the gas gauge and sees they have 150 miles until empty, so he decides to keep driving on.
Now, anyone who has been married knows this did not make the wife very happy. In fact, she was extremely worried they’d run out of gas and get stranded in the desert.
As they tensely traveled down the road, they eventually came upon a sign that said: “Gas Station: 70 miles ahead”.
The husband looked down at the gas gauge, then said to his wife, “Don’t worry. We have 90 miles until empty.”
They kept traveling on. They passed another sign: “Gas station: 50 miles ahead.”
Again, the husband checked the gas gauge and assured his wife: “Don’t worry, we have 75 miles until empty.”
They kept traveling on. Soon they passed another sign: “Gas station: 20 miles ahead.”
The husband smiled. “Don’t worry, darling. We have 40 miles until empty. We’re going to make it just fine.”
Finally, they pulled into the resort town gas station with exactly 23 miles until empty.
The husband turned to his wife and said, “See? I told you we didn’t need to stop for gas.”
They filled up the tank and continued on to the resort.
As they were checking into their room, the front desk receptionist struck up a conversation.
“Was that not the most beautiful drive you’ve ever experienced?” She asked them. “National Geographic consistently ranks it as one of the most scenic drives in all of North America, and I hope you enjoyed it.”
And the husband looked at his wife.
And the wife looked at her husband.
And they both realized something.
Had they paid any attention to the scenery on that drive?
Absolutely not.
They had spent the whole drive looking at the gas gauge.
So how does this relate to indexing?
When our clients are trying to save for retirement on the market’s red line in the chart above, they have to spend retirement wondering if they’ll have enough gas (i.e., funds) to get where they want to go. They spend much of their retirement looking at the gas gauge.
If we can help them diversify a portion of their retirement assets on the index’s green line above, they’ll know those funds can participate when the market is up and be protected when the market is down. Those features can give them some breathing room to enjoy the scenery around them.
Helping our Clients Enjoy the Ride
Complex ideas are often best explained through compelling stories. These quick tales are an easy way to relate a financial concept to something our clients understand intuitively.
Here at Stonewood Financial, we often call these “message frames,” and they are incredibly useful in marketing for financial advisors. They can be molded to fit a seminar room with 100 people or a client meeting with only two.
Looking for more? Check out this frame for explaining taxes in an IRA, and this frame for explaining the risk of rising taxes.
Ready to go all-in with these messages and more? Stonewood Financial has built toolkits for advisors like you to use in prospecting, marketing, and meetings. Check them out here, and let us know how we can help you tell better sales stories to your clients.
Free Study Group Replay
How Stonewood Advisors Stay Ahead of the Next Planning Conversation.
Watch a recent Stonewood Study Group focused on the legacy planning conversation. You’ll see how Stonewood helps advisors break down timely planning topics, client conversation angles, and practical strategies you can put to use immediately.
Expert insights. Real strategies.
Study Group Replay
Timely planning topics
Real client conversation angles
Practical strategies you can use
Real Advisors. Real Results.
See how advisors are using Stonewood software to win larger cases and deliver better
outcomes for their clients.
An advisor was working with a prospect who was a real "do-it-yourselfer" when it came to Roth conversions.
The client was converting assets up their existing tax bracket – and hadn't considered any impact to
IRMAA.
With Roth Done Right, the advisor was able to show an alternate pattern that sped up the conversion to
6 years. The new structure offered $30,000 savings in conversion taxes – a 20% reduction on the
prospect's conversion tax bill. The report also showed hundreds of thousands of dollars in long-term
tax and IRMAA savings from the converted assets – an amount the prospect hadn't been able to quantify
on his own.
Outcome
A new client with $1M in new AUM, and a $1M FIA sale to fund the conversion process.
An advisor was working with a prospect who already had assets with Ken Fisher. Fisher's team presented a
5% systematic withdrawal projection, so the advisor needed a stronger way to frame the income
conversation.
Using the Annuity Alpha report, the advisor showed how an annuity could deliver over 8% in annual cash
flow with lifetime income, plus a long-term care doubler. The contrast was clear enough that the prospect
moved forward.
Outcome
$1.5M placed and a $100K in new business revenue.
An advisor was working with a 58-year-old couple with an established, well-funded retirement income plan,
leaving an additional $3M IRA to build out a legacy for the kids. The couple's existing advisor had no
real additional plan for this money, other than to keep it in their managed account and grow that money as
much as possible for the kids.
Using the Legacy Done Right report, the advisor showed the need for tax planning on this $3M IRA.
According to the advisor, the simple analysis "opened up the wallet" to the Roth conversion story. The
advisor then used the blended Roth/Life feature in the report to show a blend of Roth Conversion assets
with some Life Insurance to help maximize the client’s legacy.
Outcome
$3M in motion. The advisor picked up a $1.5M FIA sale that will be converted to Roth. And the advisor
also sold a 5-Pay Protection focused IUL policy at $225,000 of premium per year.
An advisor group incorporated the Total Tax Burden report into the strategy presentation for all new
prospects. They ran the tax snapshot for every new client as part of their first meeting conversation,
quantifying the growing tax burden of IRA money – and illustrating the kinds of tax savings possible
when working with their firm.
Starting in January of 2023, this simple analysis was presented to every single prospect who walked in
the door. The goal was to differentiate their practice and drive overall revenue growth through various
Roth conversion strategies.
Outcome
From 2022 to 2025, new annual AUM rose from $5M to $50M. Annual FIA sales rose from $3M to $35M.
And annual life premium rose from $50K to $1M.