There’s been a lot of chatter lately (particularly from whole life producers) about the effectiveness of AG 49. Most of the talk is centered around the question: Are IUL max illustrated rates still too high?
As an actuary who’s designed life insurance products, I can answer: No. IUL illustrated rates are a good representation of potential product performance. Let me show you why.
First, a disclaimer: Like any financial or insurance product, future projections are just that – projections. Obviously, we can’t know what the future holds for the market, caps or any other features.
But with this in mind, let’s look at a few reasons IUL max illustrated rates do a good job projecting potential future experience.
Insurance indexing relies on the market, but it’s not investment in the market. That’s important to remember, so we evaluate indexing’s potential returns based on its unique return pattern. By eliminating down years with a 0% floor and capturing a portion of the market’s rise in good years, indexing follows a different set of return rules than “investment” strategies.
Let me offer up two examples that drive this point home.
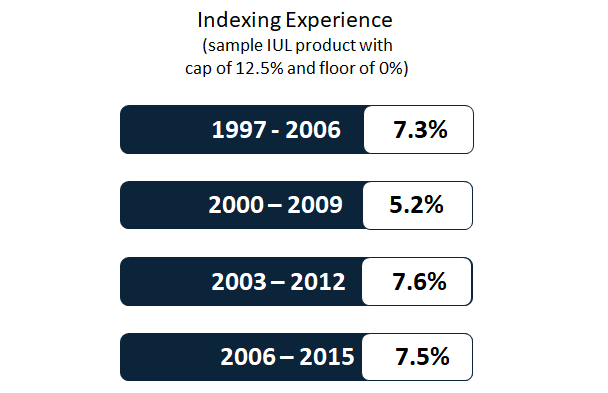
First, let’s look at index experience since IUL was introduced back in 1997. I looked at the average index returns for a hypothetical index with a floor of 0% and a cap of 12.5%. Here are the results from several 10-year periods (taken at 3-years intervals):
Do those numbers look familiar? They’re pretty close to today’s max illustrated rates on many products. If future performance mirrors past performance, max illustrated rates are right where they should be.
The second example deals with the outlier in the chart above. Let’s look at 2000-2009, the “lost decade” of investing. The market, on average, returned -1% a year. An index with a floor of 0% and a cap of 12.5% credited an average of 5.3%. As you can see, a devastating period in the market did not have a devastating effect on indexing. So even if future markets underperform, max illustrated rates are still within a reasonable range.
The bottom line? Projections for indexing vary greatly from projections for the market or other strategies, and today’s rates are in line with experts’ reasonable assumptions about the future.
Much criticism of IUL max illustrated rates comes from whole life producers – which is to be expected. After all, in many cases consumers and advisors are choosing IUL over whole life. Many of these arguments center around the belief that IUL credited rates should average about the same as the fixed interest rate imbedded in a whole life dividend calculation. But this argument is simply wrong: The IUL policyholder is giving up the certainty of a fixed rate for the more volatile indexed rate. Theoretically, the more volatility, the higher the expected or mean rate should be.
Finally, it’s worth remembering the committee that developed AG 49 was comprised of regulators, representatives from insurers selling IUL and representatives from insurers selling dividend paying Whole Life. The resulting regulation was considered with input from all groups. I believe we’ll see this regulation stand the test of time.
Thoughts? Insights? Want to learn more about tax-free income strategies using IUL? Let’s talk.
Free Study Group Replay
How Stonewood Advisors Stay Ahead of the Next Planning Conversation.
Watch a recent Stonewood Study Group focused on the legacy planning conversation. You’ll see how Stonewood helps advisors break down timely planning topics, client conversation angles, and practical strategies you can put to use immediately.
Expert insights. Real strategies.
Study Group Replay
Timely planning topics
Real client conversation angles
Practical strategies you can use
Real Advisors. Real Results.
See how advisors are using Stonewood software to win larger cases and deliver better
outcomes for their clients.
An advisor was working with a prospect who was a real "do-it-yourselfer" when it came to Roth conversions.
The client was converting assets up their existing tax bracket – and hadn't considered any impact to
IRMAA.
With Roth Done Right, the advisor was able to show an alternate pattern that sped up the conversion to
6 years. The new structure offered $30,000 savings in conversion taxes – a 20% reduction on the
prospect's conversion tax bill. The report also showed hundreds of thousands of dollars in long-term
tax and IRMAA savings from the converted assets – an amount the prospect hadn't been able to quantify
on his own.
Outcome
A new client with $1M in new AUM, and a $1M FIA sale to fund the conversion process.
An advisor was working with a prospect who already had assets with Ken Fisher. Fisher's team presented a
5% systematic withdrawal projection, so the advisor needed a stronger way to frame the income
conversation.
Using the Annuity Alpha report, the advisor showed how an annuity could deliver over 8% in annual cash
flow with lifetime income, plus a long-term care doubler. The contrast was clear enough that the prospect
moved forward.
Outcome
$1.5M placed and a $100K in new business revenue.
An advisor was working with a 58-year-old couple with an established, well-funded retirement income plan,
leaving an additional $3M IRA to build out a legacy for the kids. The couple's existing advisor had no
real additional plan for this money, other than to keep it in their managed account and grow that money as
much as possible for the kids.
Using the Legacy Done Right report, the advisor showed the need for tax planning on this $3M IRA.
According to the advisor, the simple analysis "opened up the wallet" to the Roth conversion story. The
advisor then used the blended Roth/Life feature in the report to show a blend of Roth Conversion assets
with some Life Insurance to help maximize the client’s legacy.
Outcome
$3M in motion. The advisor picked up a $1.5M FIA sale that will be converted to Roth. And the advisor
also sold a 5-Pay Protection focused IUL policy at $225,000 of premium per year.
An advisor group incorporated the Total Tax Burden report into the strategy presentation for all new
prospects. They ran the tax snapshot for every new client as part of their first meeting conversation,
quantifying the growing tax burden of IRA money – and illustrating the kinds of tax savings possible
when working with their firm.
Starting in January of 2023, this simple analysis was presented to every single prospect who walked in
the door. The goal was to differentiate their practice and drive overall revenue growth through various
Roth conversion strategies.
Outcome
From 2022 to 2025, new annual AUM rose from $5M to $50M. Annual FIA sales rose from $3M to $35M.
And annual life premium rose from $50K to $1M.